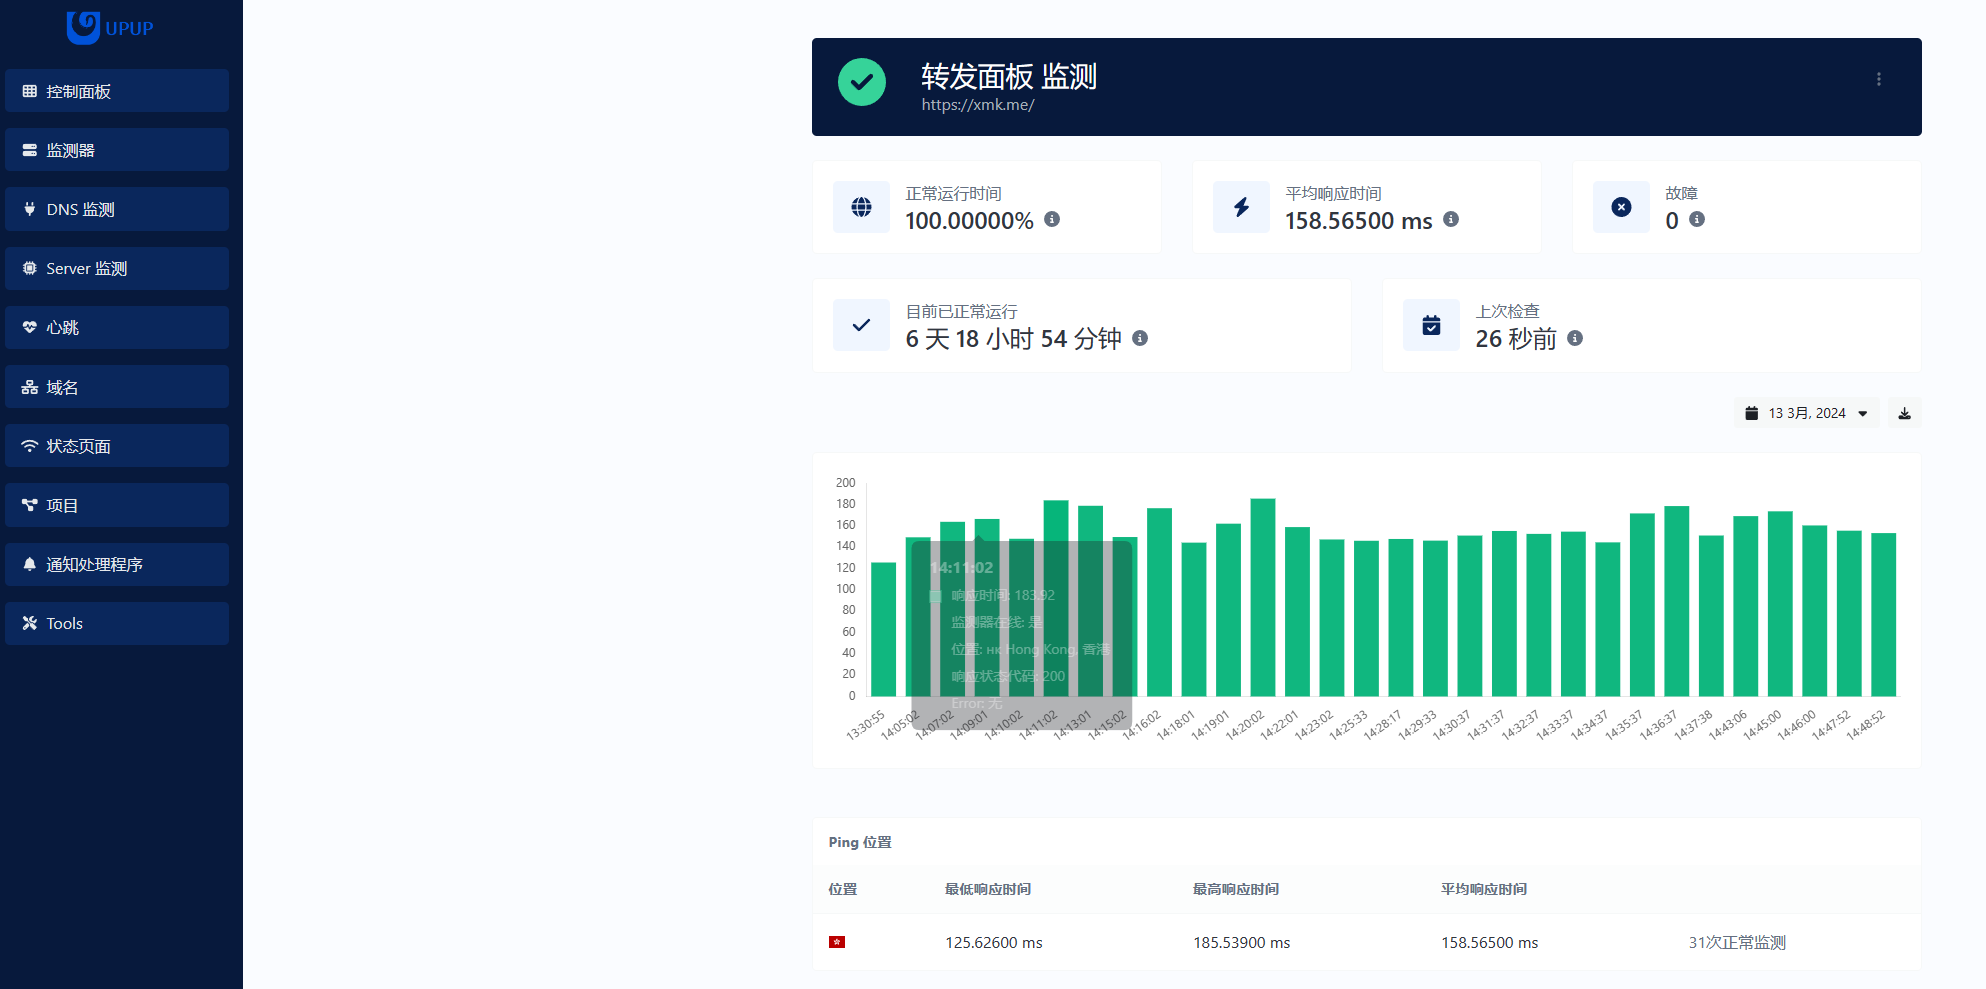
Uptime 可轻松跟踪网站,服务器和端口的可用性
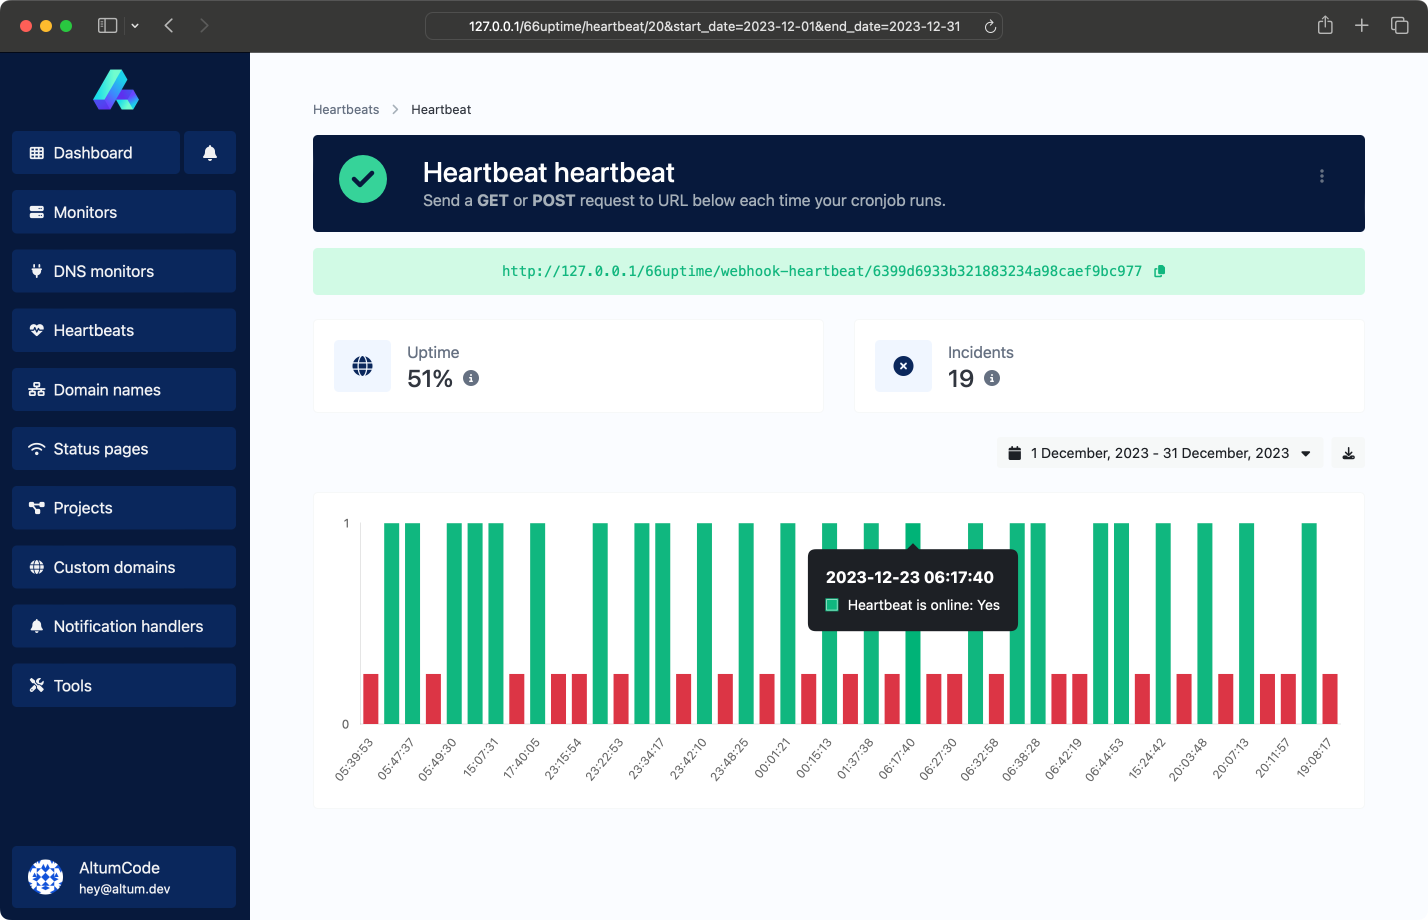
监测您的 Cron 定时任务并确保它们确实在运行
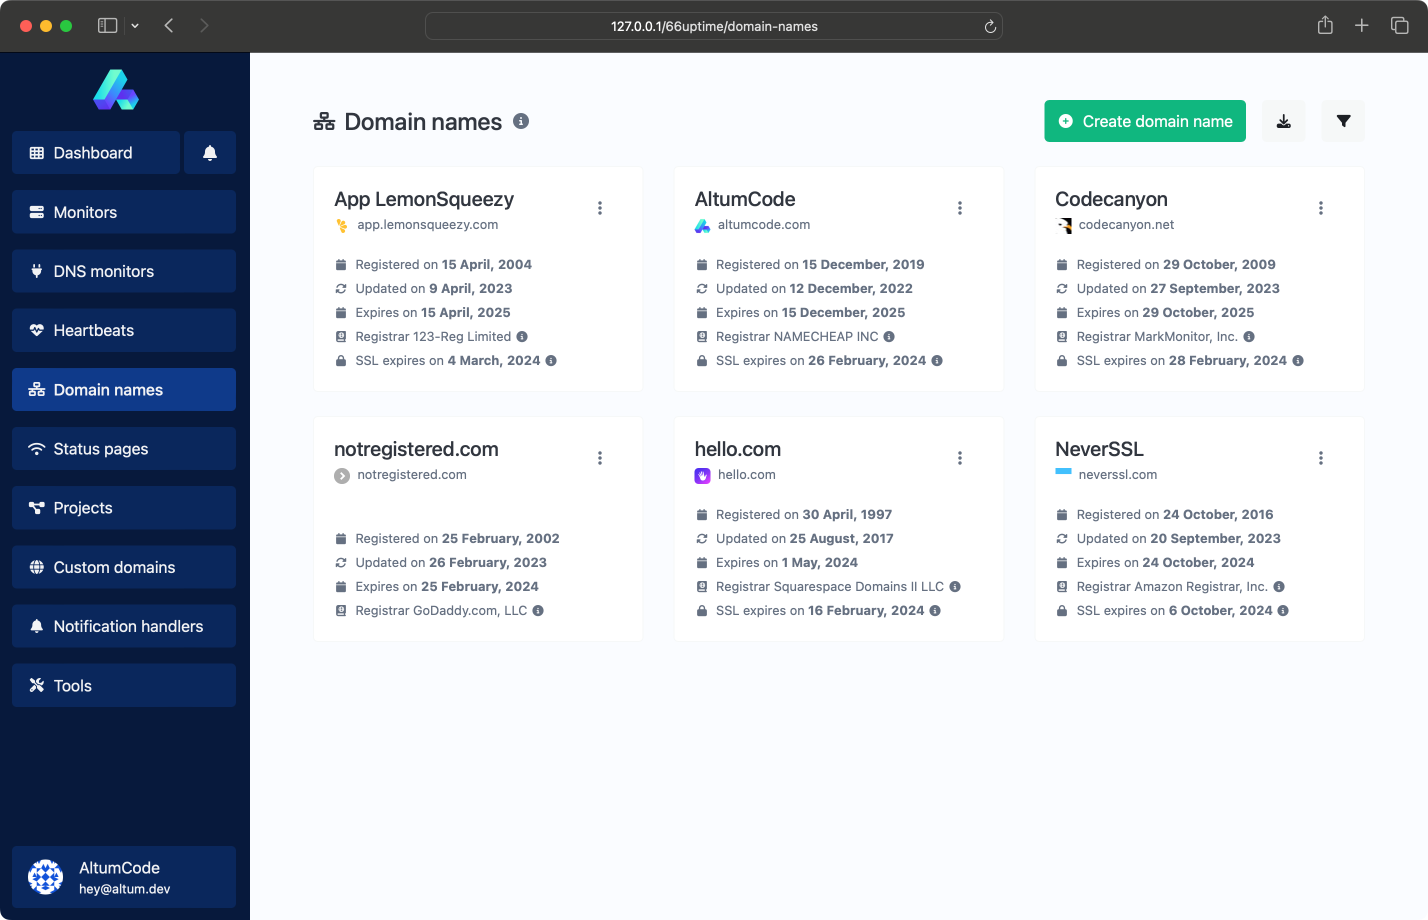
监控域名和SSL证书过期日期
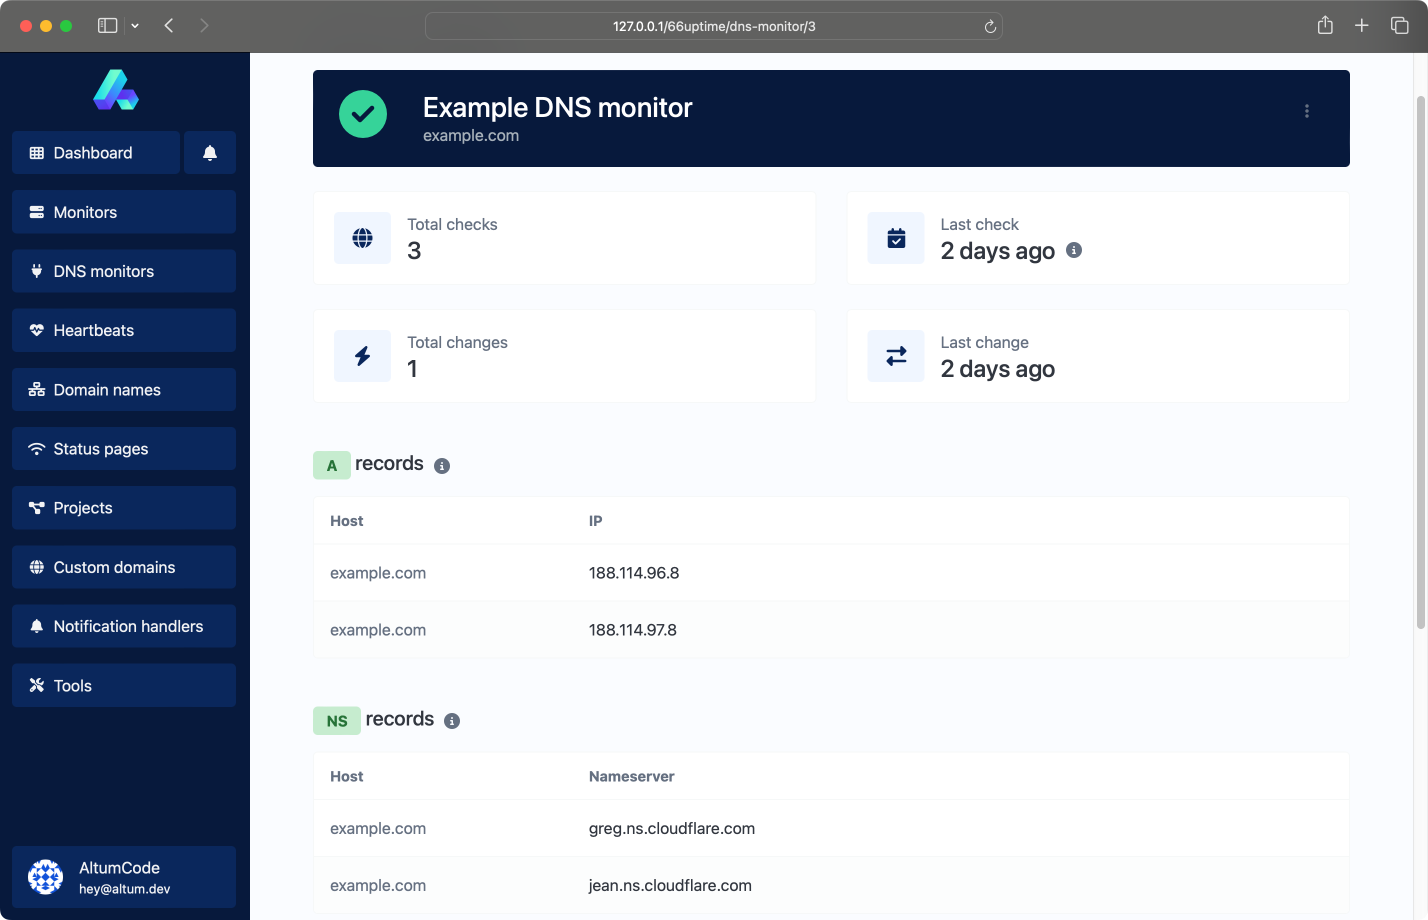
当您的域DNS发生更改时会得到通知,轻松跟踪。
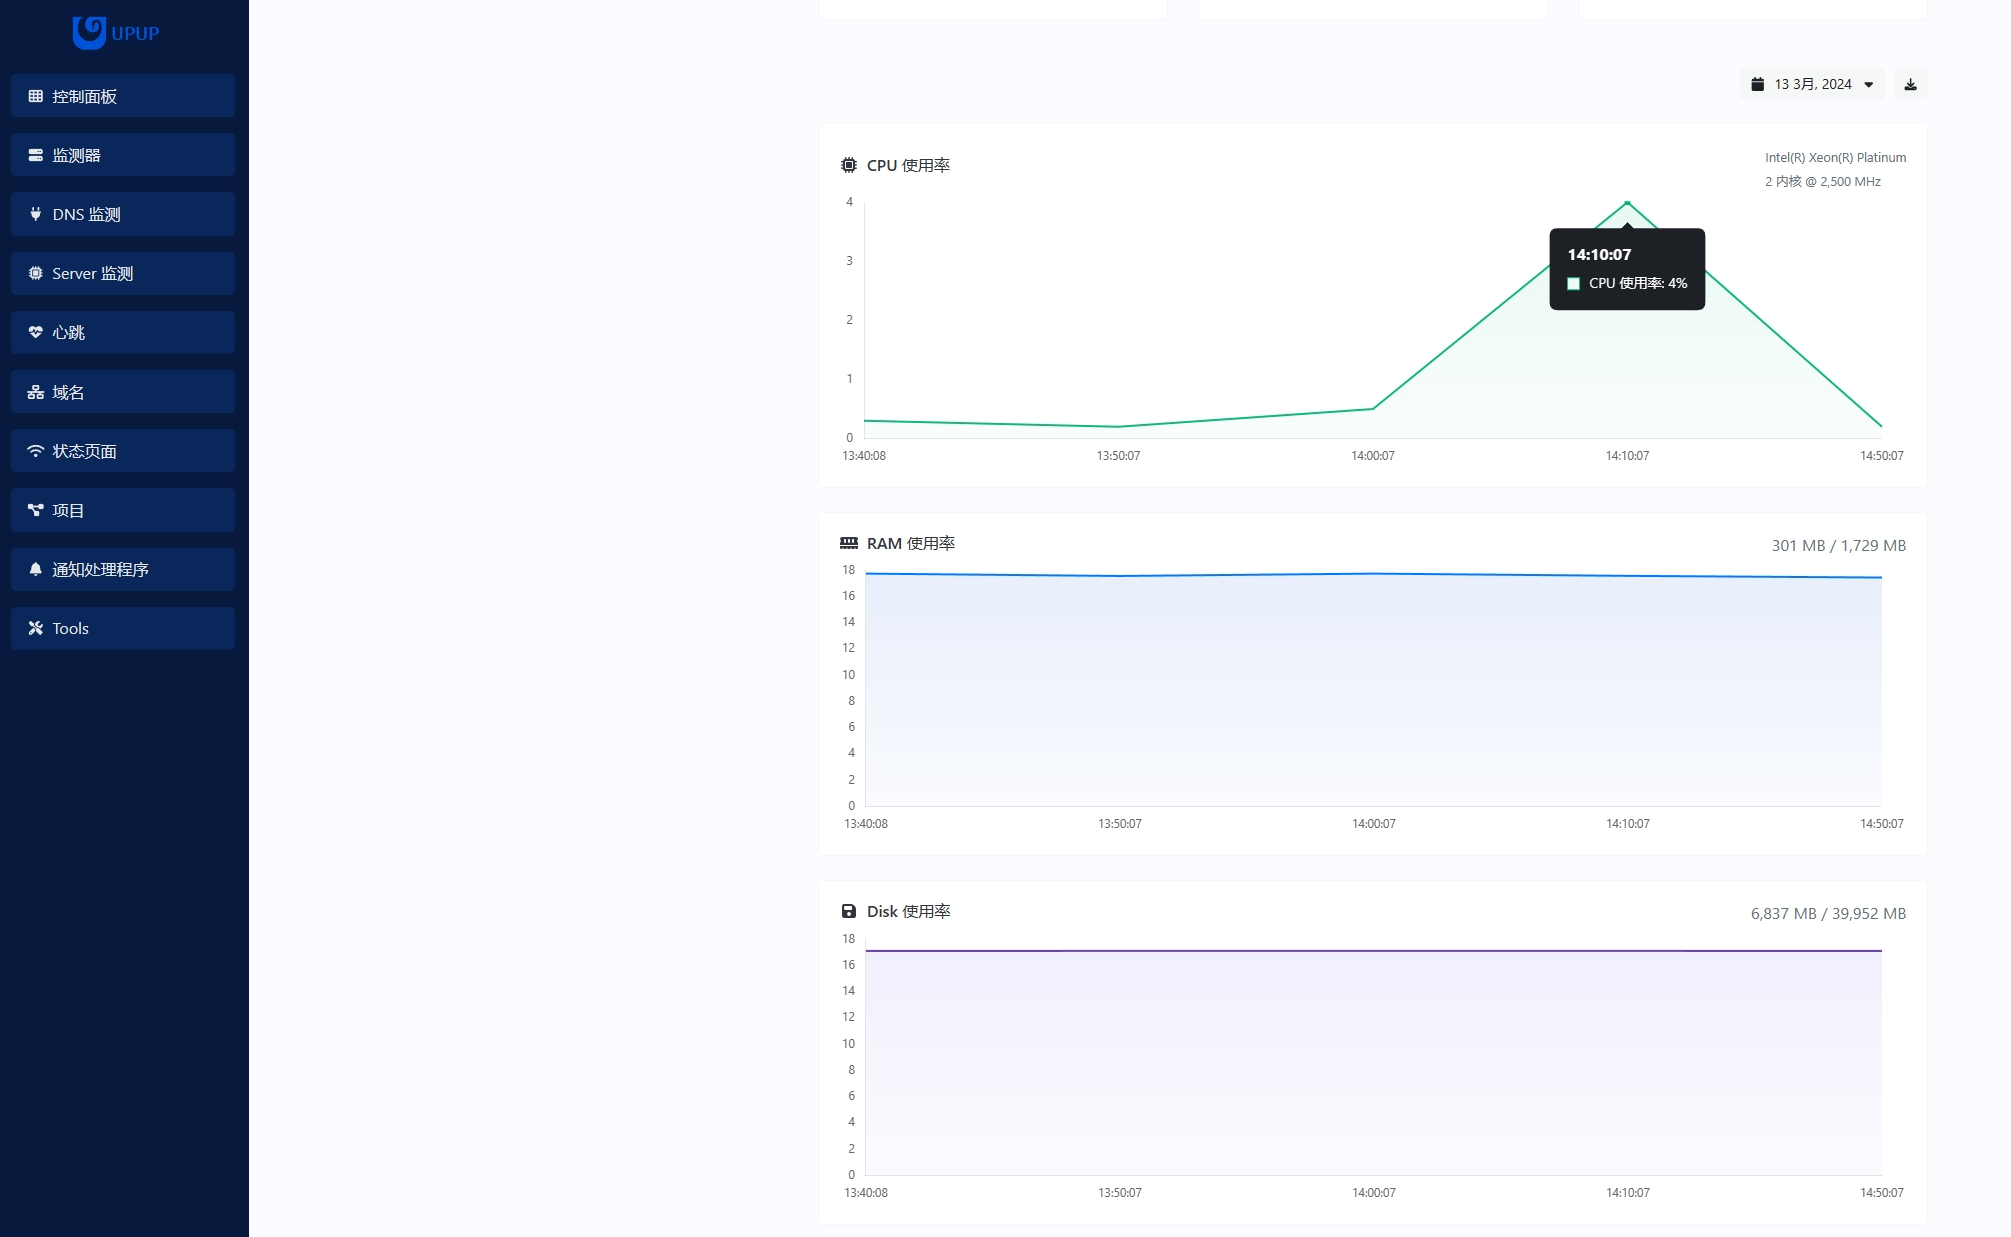
Server 监控
跟踪Linux服务器上的资源 (CPU, Disk, Ram...等等)
CPU usage and load
RAM usage
Disk usage
Custom usage alerts
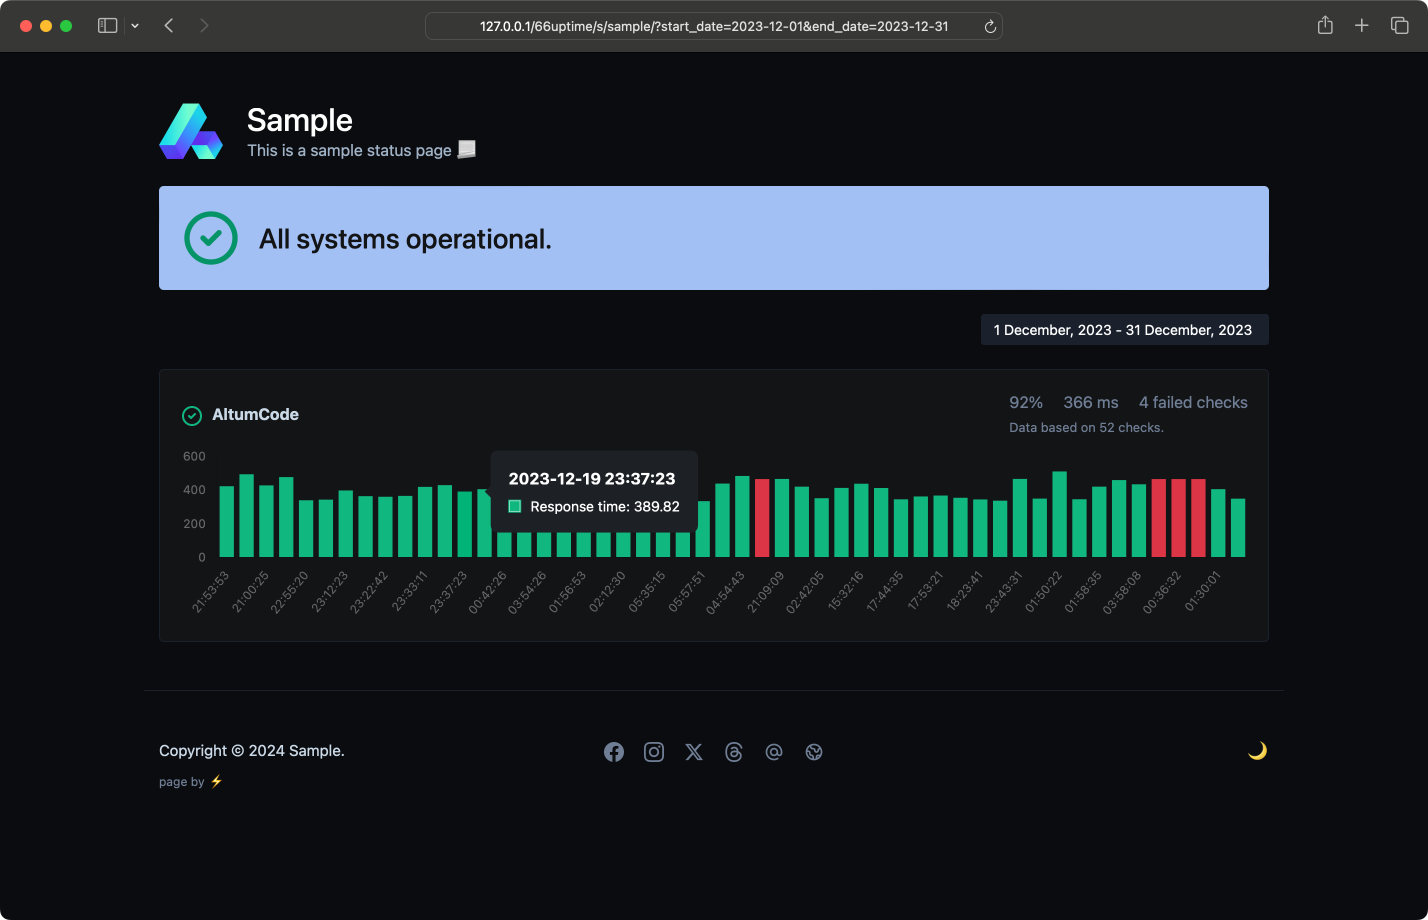
状态页面
对访问者透明,并美观地显示监测器统计数据
Visitors & pageviews analytics
Password protected
Lightweight, fast & SEO optimized
Advanced analytics & customizable pages
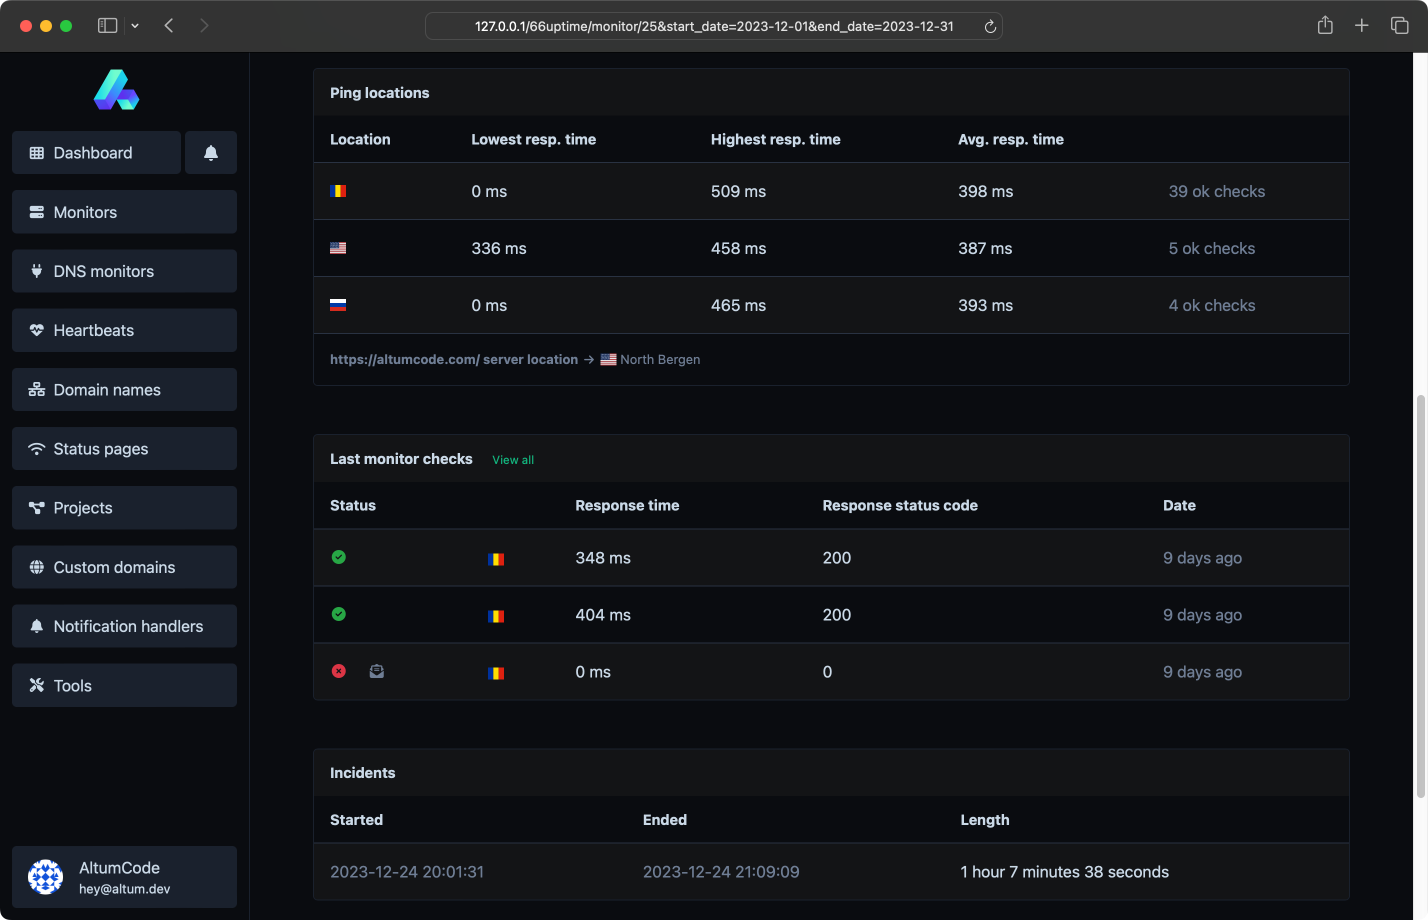
事件
了解网站不可用的时间和持续时间,并获得即时电子邮件通知
Custom failed checks triggers
Multiple channels at once
Understand why it failed
Leave notes for the incidents
6 useful tools
Web utility tools. Fast, reliable and easy to use.
我们对总共 81 个网站 进行了 1,193,056 次监测. 我们还托管了 37 个状态页面

多个位置
我们从全球多个地点监测您的网站
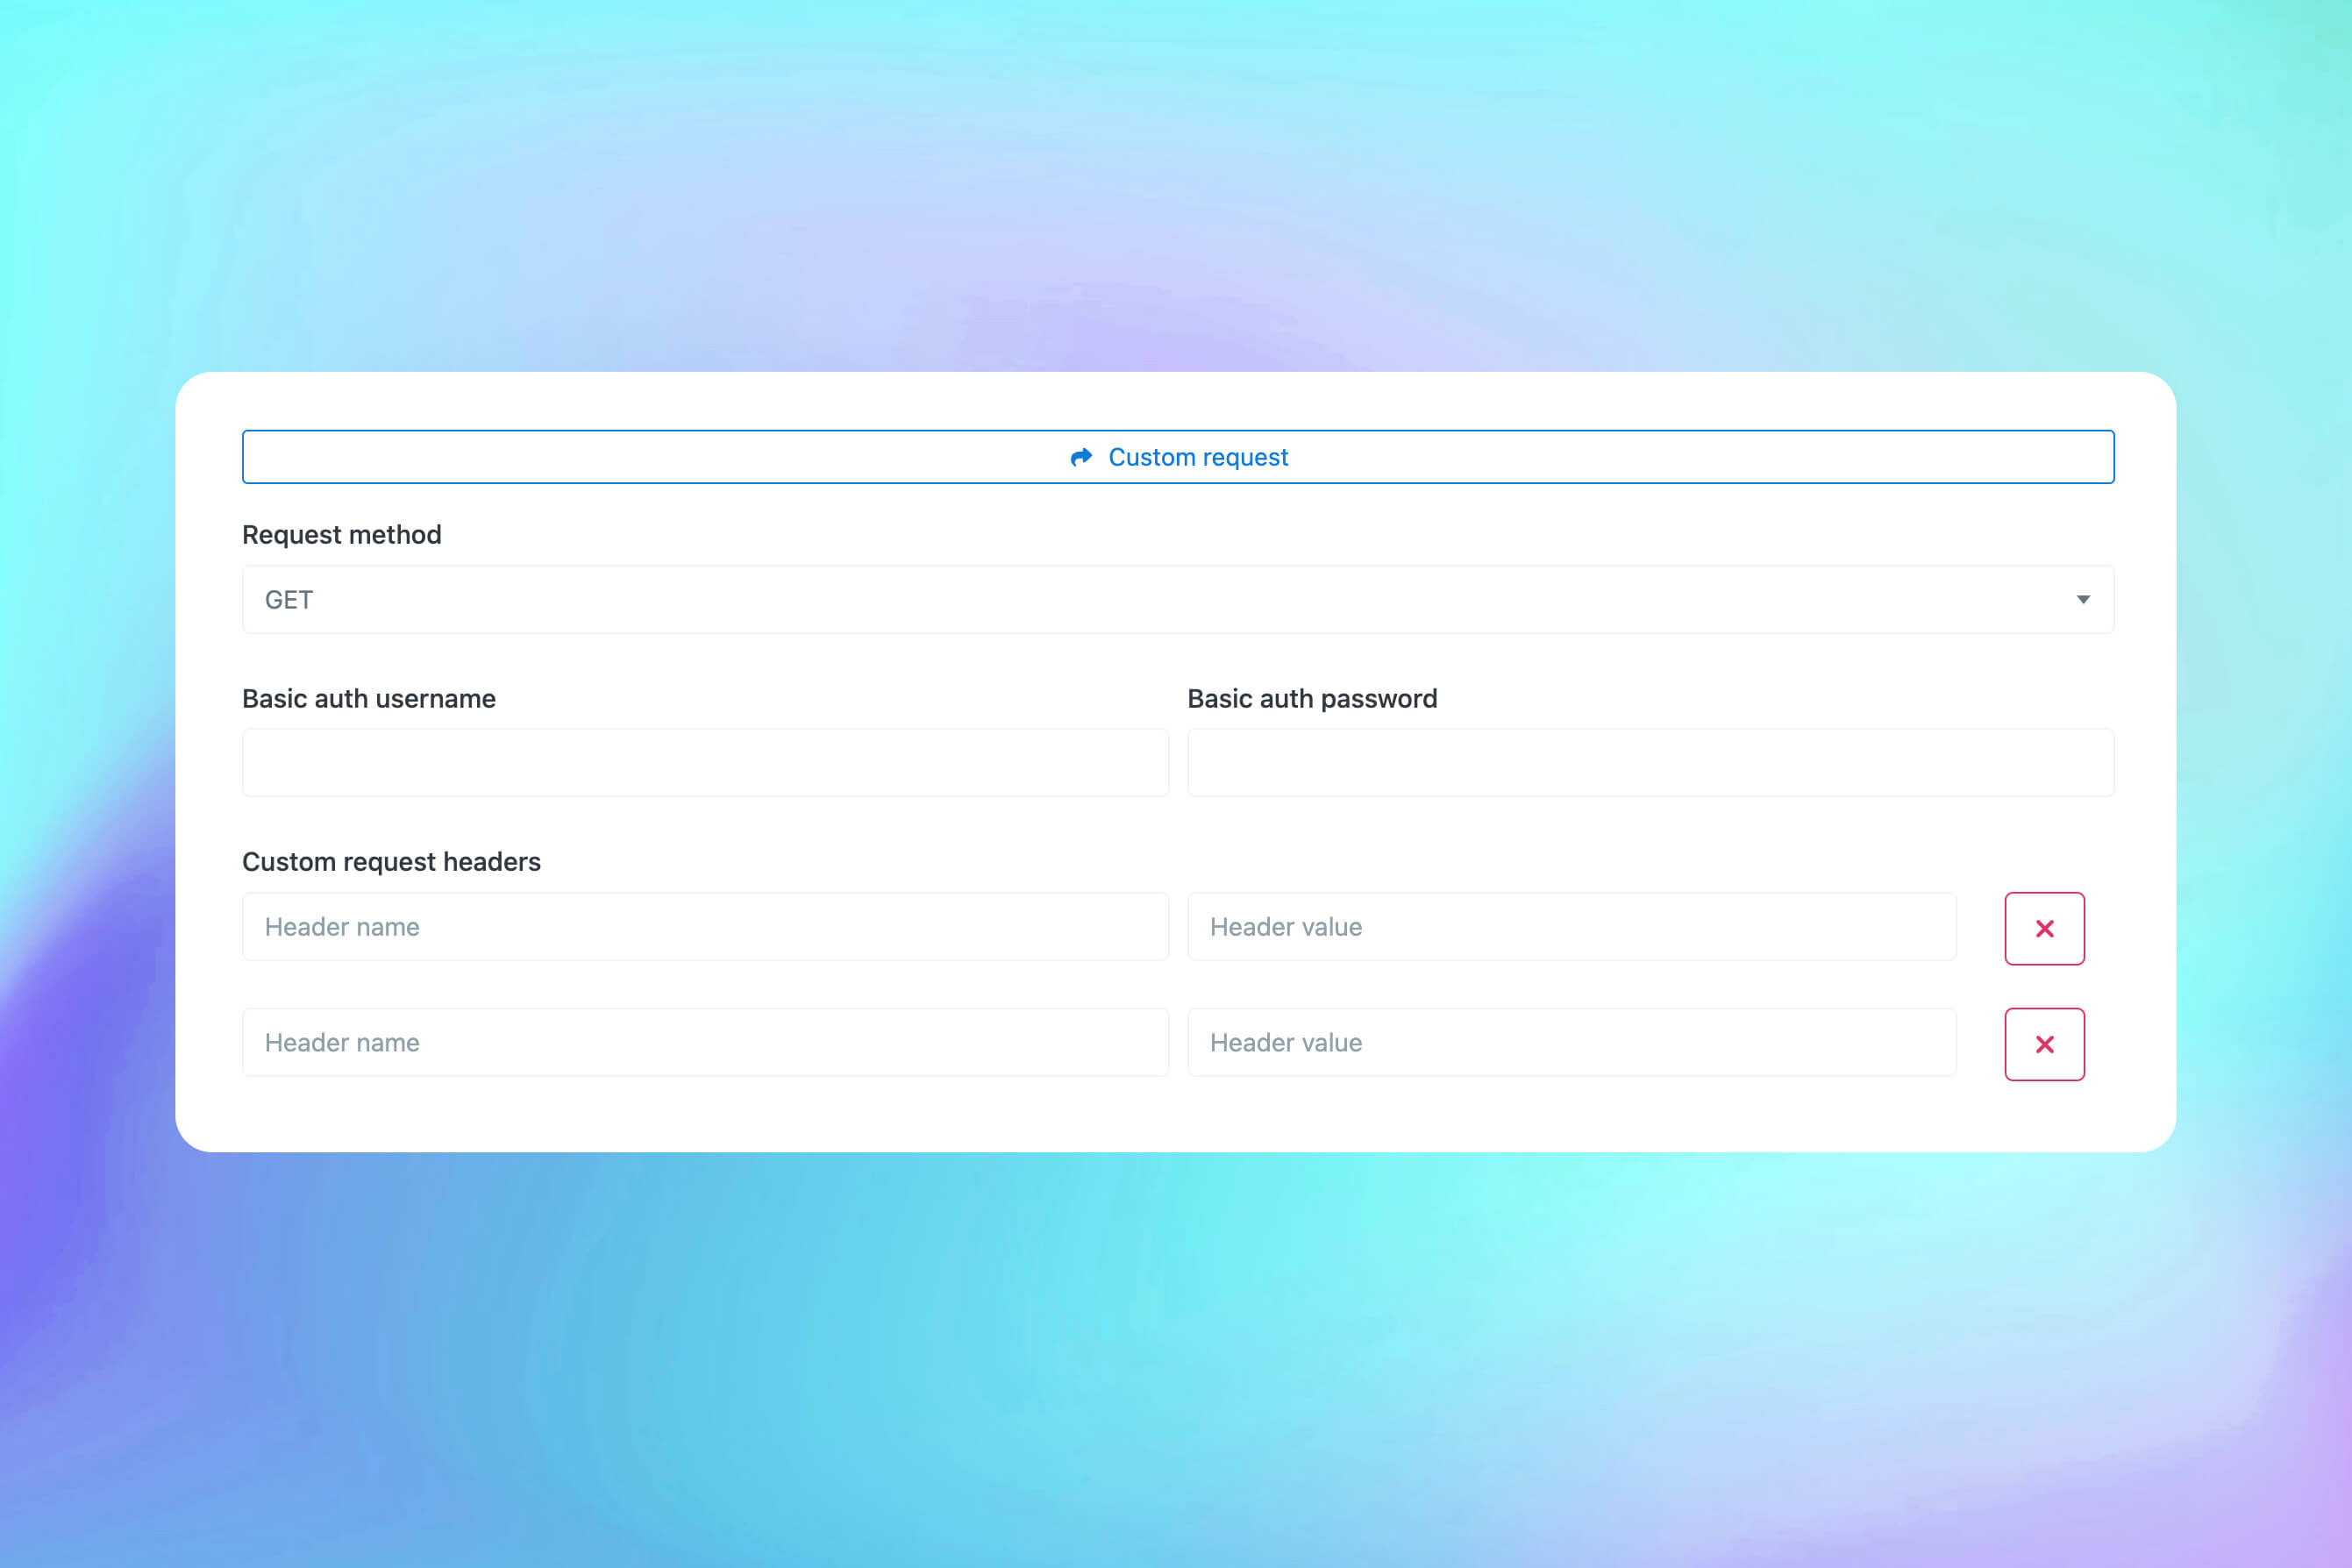
自定义 HTTP 请求
请求方法,请求正文,基本认证和自定义请求标题
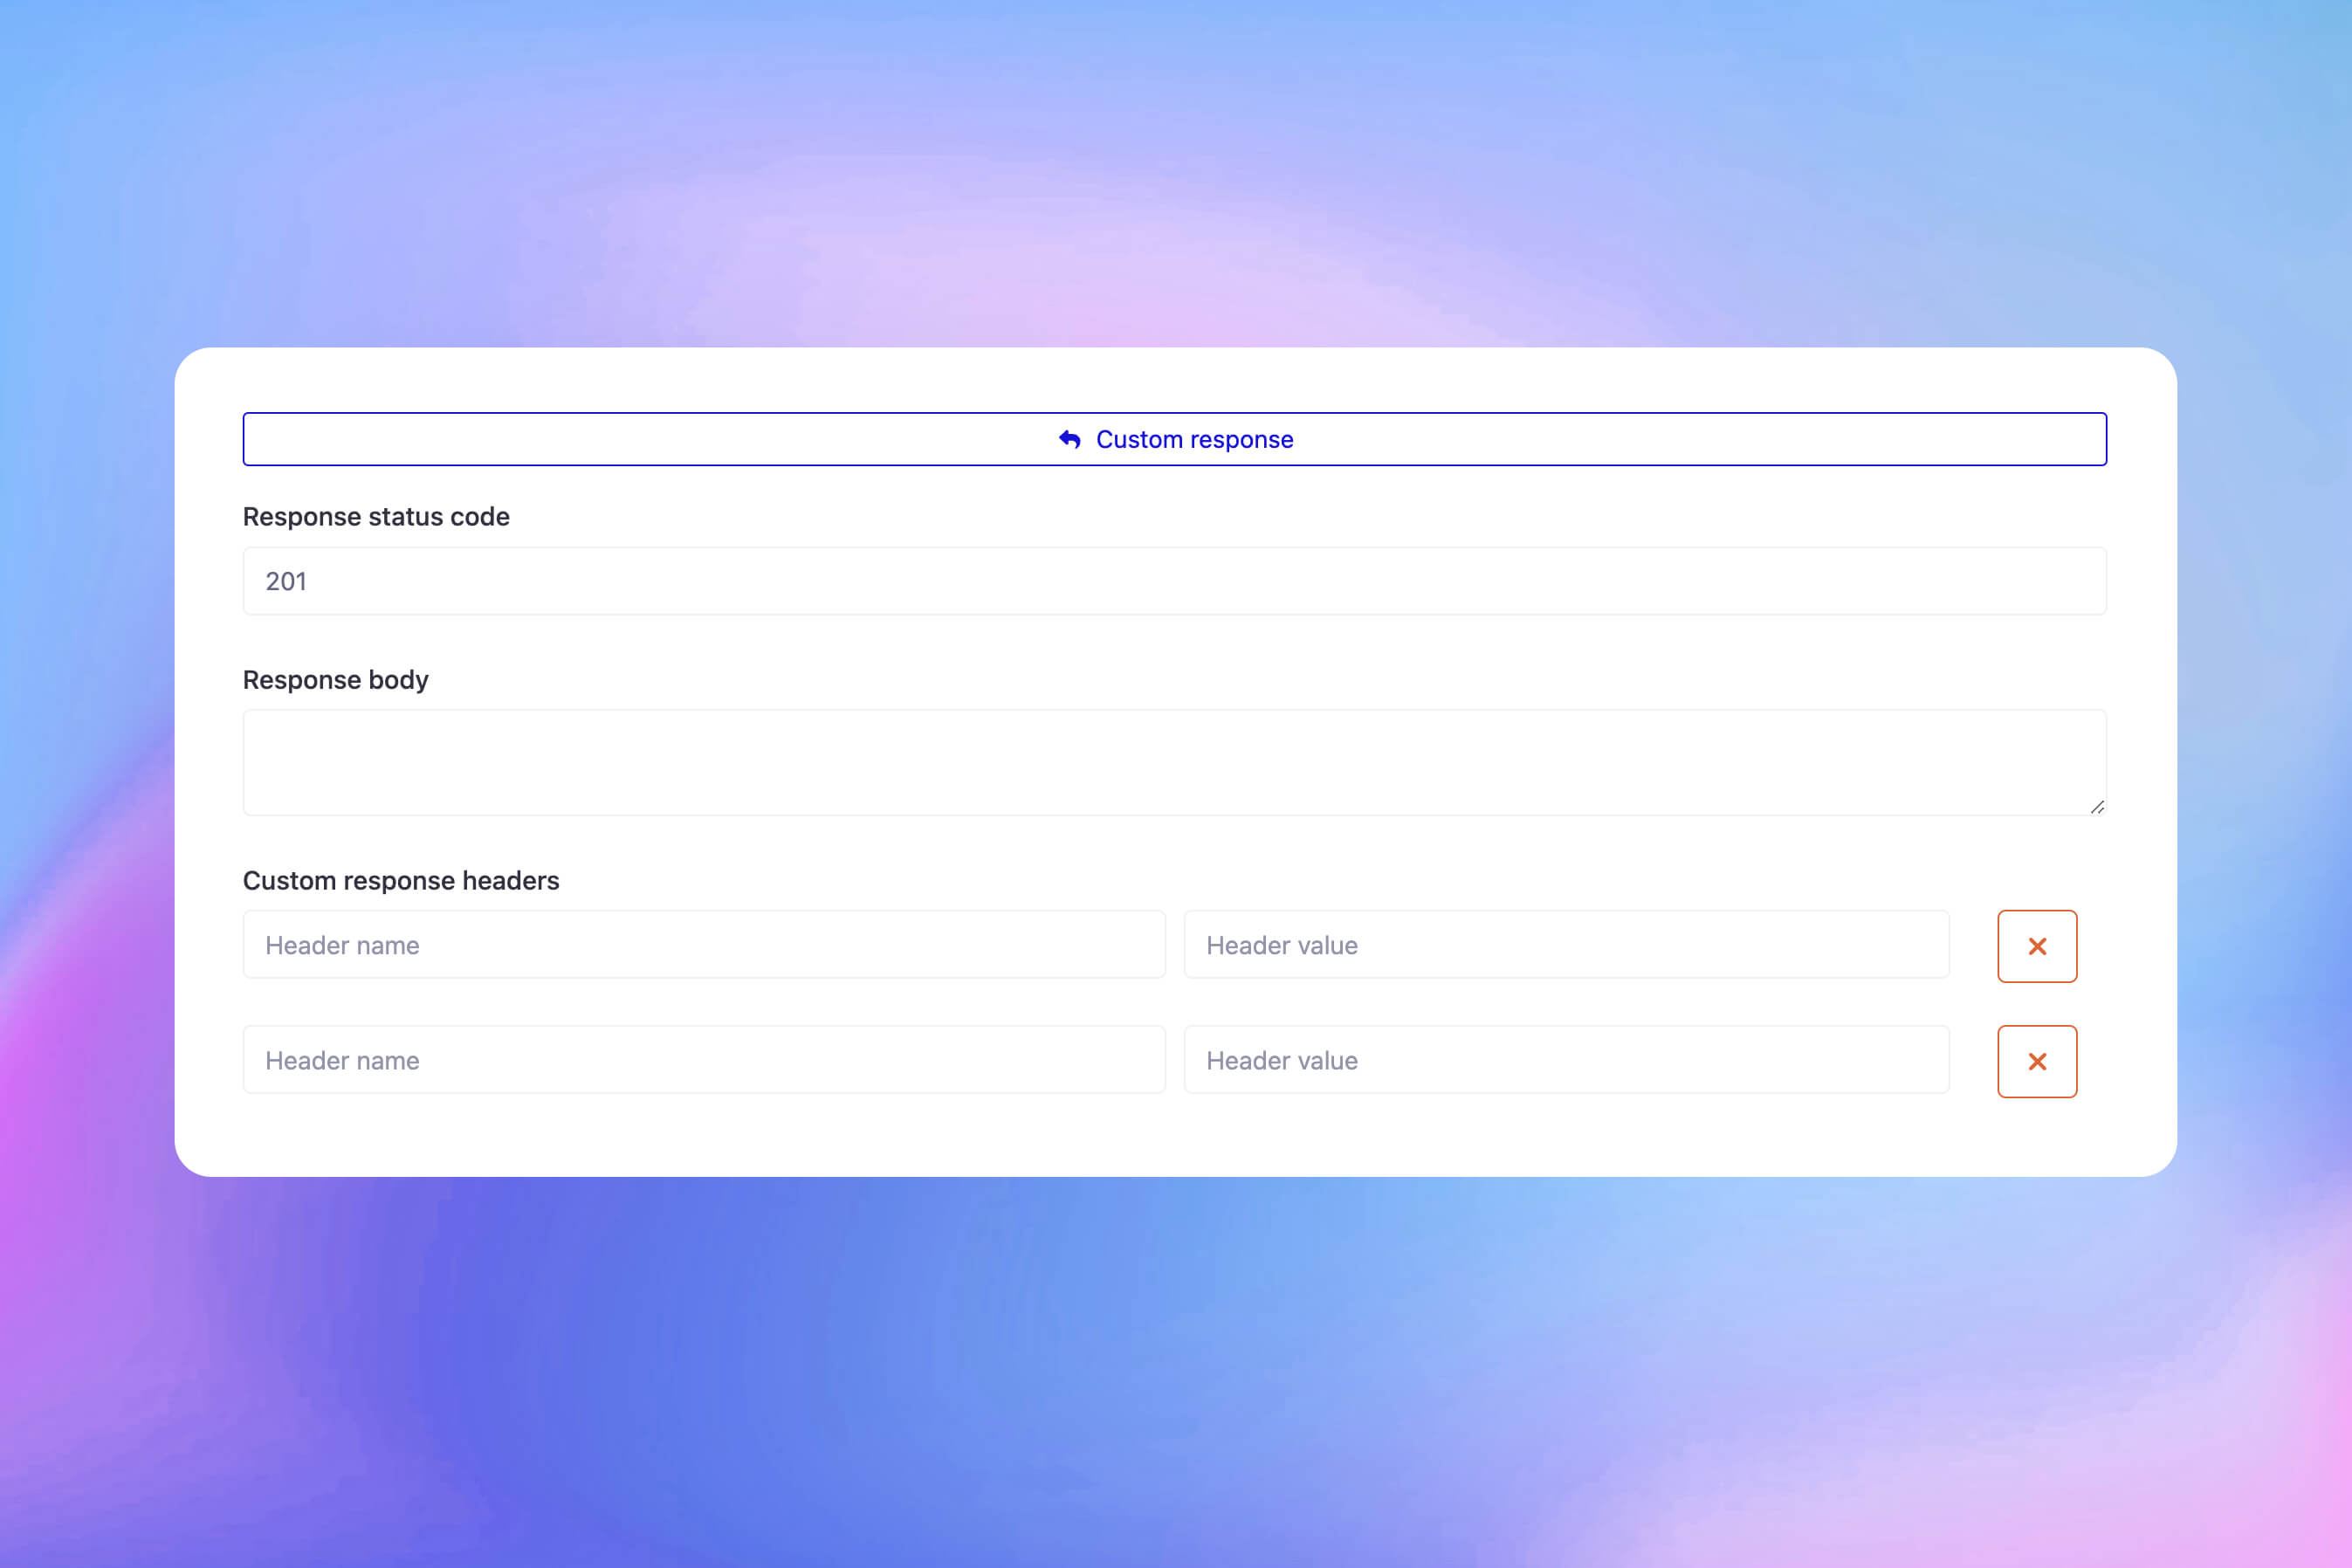
自定义 HTTP 响应
设置并期望监测器做出特定响应
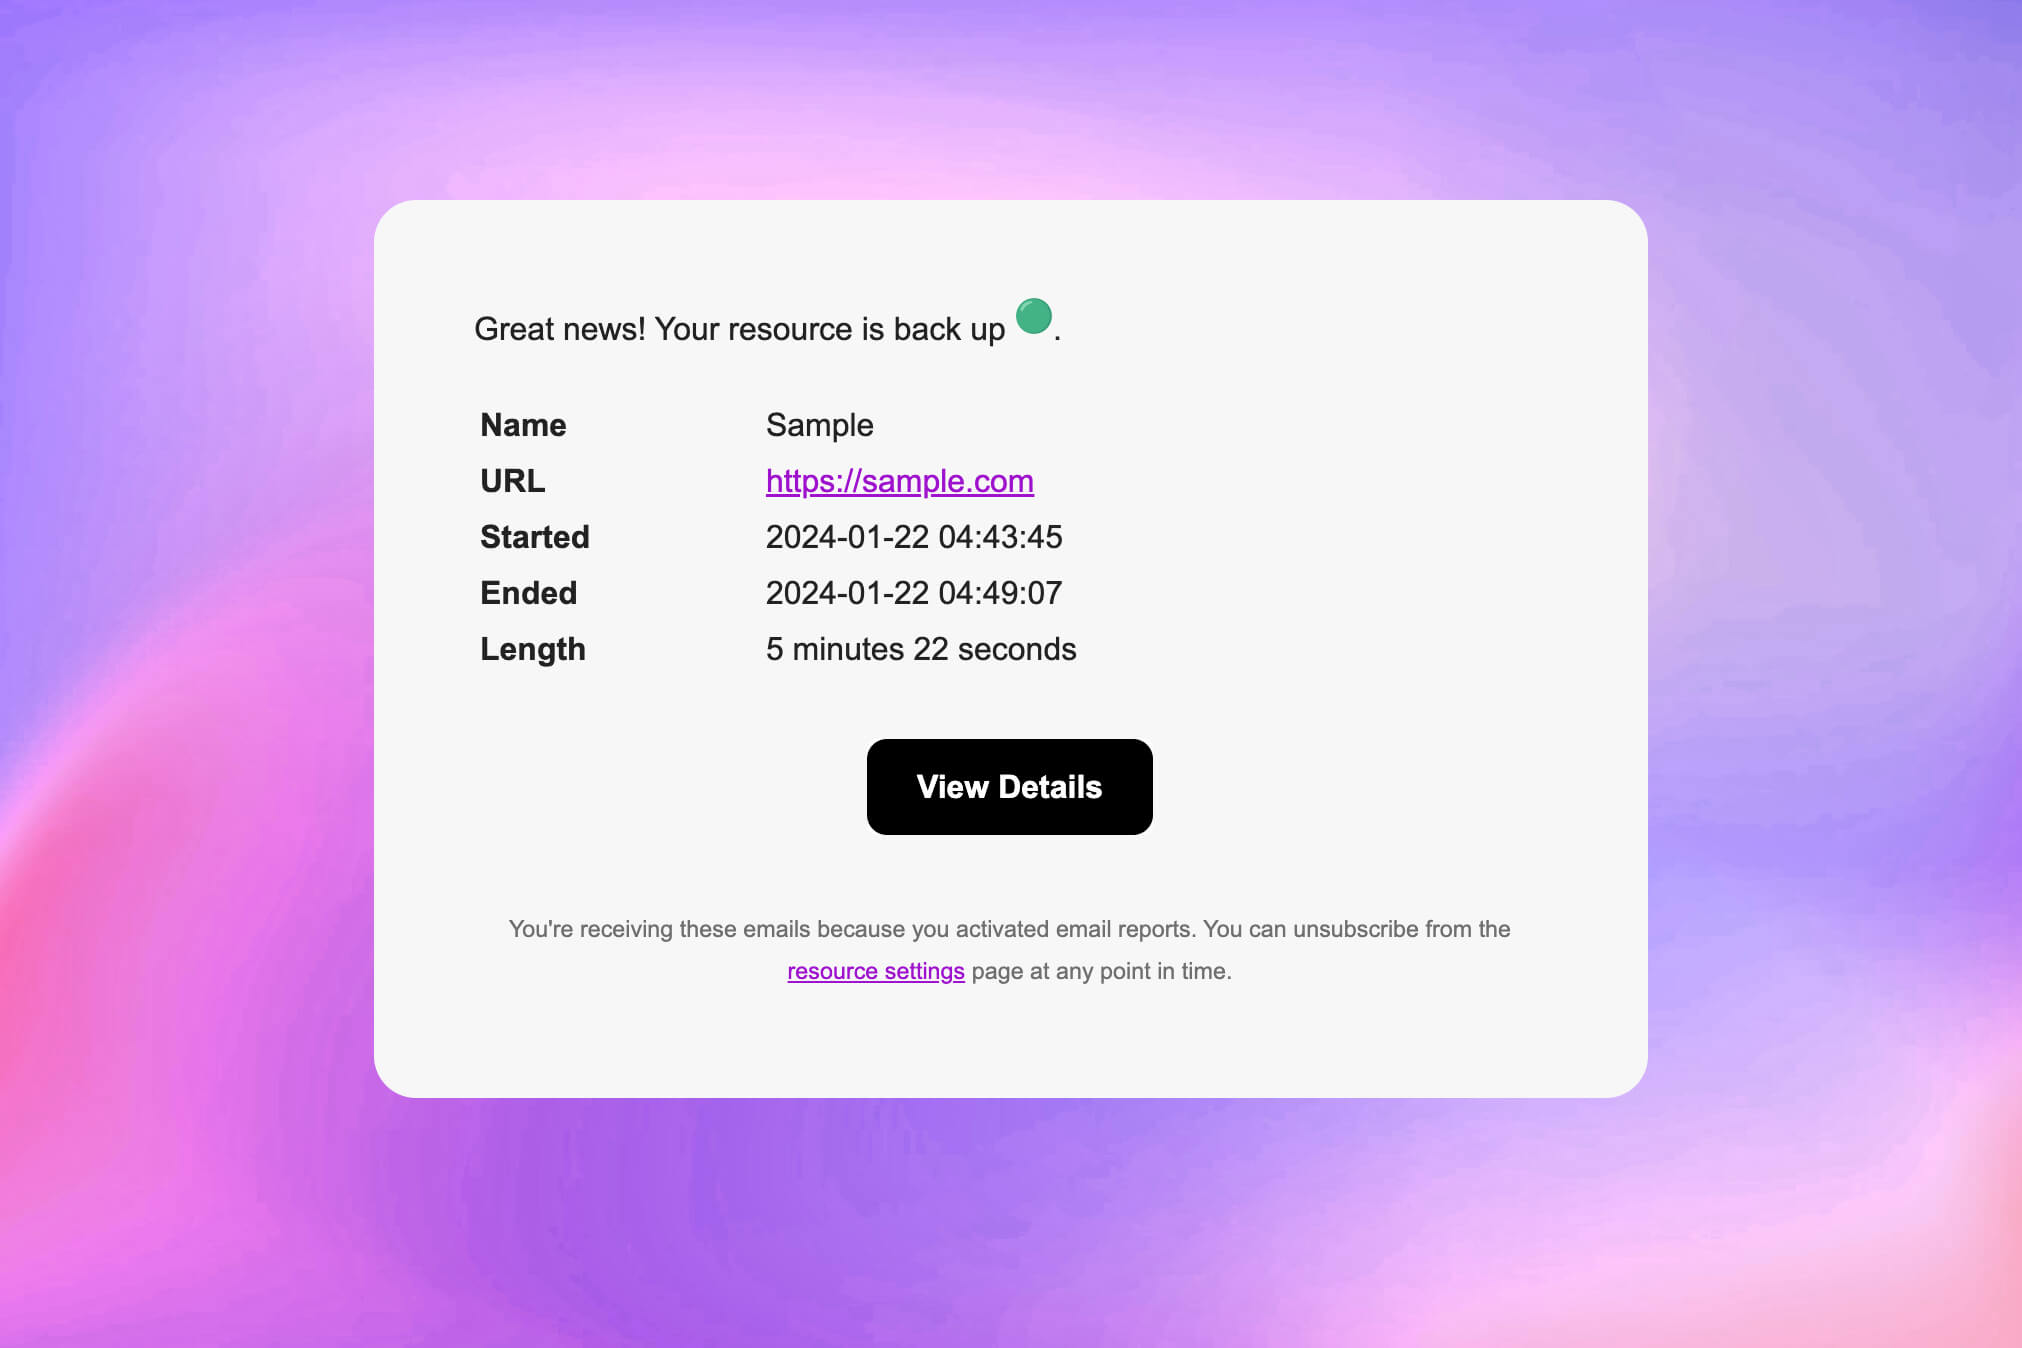
电子邮件通知
当您跟踪的服务运行或宕机时获取即时通知

项目
对您管理的资源进行分类的最简单方法
Get notified with ease
Countless notification integrations for any needs.
电子邮件
Webhook
Telegram
开始
跟踪服务器的正常运行时间并在状态页面上显示其统计数据